
Fri
Apr 13 2007
01:28 pm
By: djuggler
I have also created an alternate proposal for rezoning.
Would you like to know how your new school performs compared to others? Visit SchoolMatters and follow the steps outlined after the jump.
You should end up with these results but if you click on the school names and others areas of the table (not mine..your results found at SchoolMatters) you will receive a wealth of information and charts.
| School | Reading | Math | ACT Average |
|---|---|---|---|
| Austin East | 73.9 | 61.7 | 17.4 |
| Bearden | 97.8 | 94.1 | 23.3 |
| Farragut | 97.9 | 93.5 | 23.7 |
| Powell | 90.6 | 89.4 | 21.1 |
| West | 87.5 | 82.6 | 22.1 |
| Fulton | 83.9 | 77.6 | 18.3 |
| Gibbs | 87.0 | 80.6 | 20.3 |
| Halls | 90.4 | 89.2 | 22.0 |
| Karns | 92.7 | 95.2 | 21.4 |
| South Doyle | 85.1 | 79.6 | 20.7 |
| Carter | 90.3 | 87.0 | 20.0 |
| Central | 88.6 | 86.5 | 21.6 |
| Data provided by SchoolMatters, a service of Standard and Poor's. | |||
Click read more for instructons on generating your own comparison...
- Enter the name of a school that interests you.

- Select the appropriate school and click "Add to favorites"
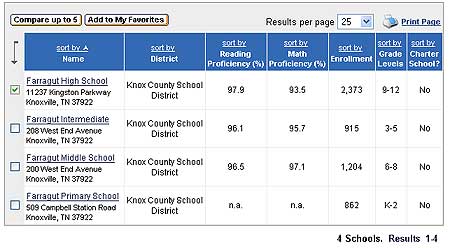
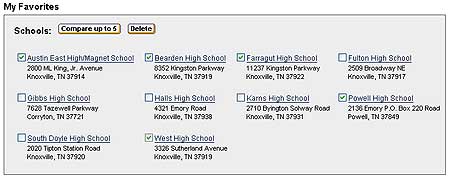
- Click "My Favorites"

- Select 5 schools to compare. Then click "Compare up to 5".
- Enjoy the results. Click everything because much data is beneath the table!

|
Topics:
|
|
Discussing:
- Smith & Wesson noise problem (1 reply)
- Musicians dropping out of President's Freedom Concert Series (1 reply)
- It's time for new blood in Congress, Barnett in - Burchett out (1 reply)
- Burning Down The House... (2 replies)
- Behind Lege Lies (1 reply)
- Peace (1 reply)
- Speak your truth, fight and believe. (1 reply)
- Large banks have too much AI data center debt? (1 reply)
- GOP misleading on federal health care funding (1 reply)
- Feds indict civil rights group (3 replies)
- Georgia issues burn ban, first time in state history (2 replies)
- State of TN proposes exempting voucher students from standardized testing (1 reply)
TN Progressive
- Smith & Wesson not a good fit for Blount County (BlountViews)
- Pellissippi Parkway extension delayed again (BlountViews)
- Blount County early voting record turnout (BlountViews)
- Louisville, TN, town center coming soon? (BlountViews)
- WATCH THIS SPACE. (Left Wing Cracker)
- America As It Is Right Now (RoaneViews)
- A friend sent this: From Captain McElwee's Tall Tales of Roane County (RoaneViews)
- The Meidas Touch (RoaneViews)
- Massive Security Breach Analysis (RoaneViews)
- (Whitescreek Journal)
- My choices in the August election (Left Wing Cracker)
- July 4, 2024 - aka The Twilight Zone (Joe Powell)
TN Politics
- How Trump’s giant ‘slush fund’ sparked lawsuits, roiled Republicans and revived Jan. 6 (TN Lookout)
- TN unemployment low, but sheds jobs for the 5th month in a row (TN Lookout)
- FEMA payouts for Tennesseans affected by winter ice storm surpass $36 million (TN Lookout)
- Editor’s notebook: The silence of Tennessee’s ‘statesmen’ (TN Lookout)
- Inside the fight against ‘zombie deer disease,’ scientists confront changing politics (TN Lookout)
- Rental rates and abortion laws: Dems scrutinize states vying to go first in picking a president (TN Lookout)
Knox TN Today
- Mark my word, Derek Owings is significant addition (Knox TN Today)
- Det. Kayleigh Phegley: It’s all about two families – Hers & KCSO (Knox TN Today)
- LMU Law graduates 105 + In Memoriam: McAfee, Brogan ++ (Knox TN Today)
- Meet Olivia: Monday’s Parent-A-Child (Knox TN Today)
- Mission Monday: Empowering community ministries. Today’s focus on Second Harvest Food Bank (Knox TN Today)
- What Tennessee’s bail amendment would actually change (Knox TN Today)
- Shoes for International Overdose Awareness Day (Knox TN Today)
- Monthly reminder: Organizations supporting local businesses (Knox TN Today)
- Why didn’t I think of that? (Knox TN Today)
- HEADLINES: News and events from Knox, World, USA, Tennessee & History (Knox TN Today)
- Tennessee softball advances, baseball bows out (Knox TN Today)
- Freshman homers to help Lady Vols win WCWS opener (Knox TN Today)
Local TV News
- Kayaking trip turns into nightmare as floodwaters sweep away kayakers, gear (WATE)
- 'Thought we were going to die': House swept away during Cocke County flooding (WATE)
- Knoxville man get refund 14 months after wrong windows delivered (WATE)
- Silver Alert issued for missing 74-year-old man last seen in Sevierville (WATE)
- New units open at affordable housing complex for older adults in Knox County (WATE)
- Newport man charged with animal cruelty in gruesome dog killing (WATE)
News Sentinel
State News
- Times Opinion: There’s nothing efficient about Weston Wamp’s county government - Chattanooga Times Free Press (Times Free Press)
- Community Voice: Americans don’t want war with Cuba. Will Tennessee representatives take our side? - Chattanooga Times Free Press (Times Free Press)
- Temporary lane closures set through week for ‘blue bridge’ inspection - Chattanooga Times Free Press (Times Free Press)
- Who Is Writing Our Local News, And Who Sent Them? - And Response - Chattanoogan.com Breaking News (Times Free Press)
Wire Reports
- Trump’s payout fund on shaky ground as Republicans push for retreat - The Washington Post (US News)
- Middle East crisis live: Lebanon’s US embassy says Hezbollah has agreed to ‘reciprocal’ ceasefire with Israel under US proposal - The Guardian (US News)
- North Carolina police officer seen punching woman during arrest faces assault charge - WLOS (US News)
- Alphabet plans to raise $80B to pay for AI buildout - TechCrunch (Business)
- Live Updates: Trump says Iran talks continuing at "rapid pace" after regime threatens "other fronts" in war - CBS News (US News)
- Bus driver in Stafford Co. crash indicted on charges tied to all 5 deaths - WTOP (US News)
- Berkshire Hathaway buys homebuilder Taylor Morrison in first deal under new CEO - AP News (Business)
- Former Mesa County Clerk Tina Peters released from prison - Colorado Public Radio (US News)
- Police investigate videos of men mysteriously emerging from New York City sewers - NBC News (US News)
- Scoop: Platner heads to D.C. for senator meetings and fundraisers - Axios (US News)
- McDonald’s Wants to Be Fancier With Its Chicken and Restaurants - Yahoo Finance (Business)
- Florida sues OpenAI, Sam Altman after multiple ChatGPT-linked murders - Ars Technica (Business)
- AI giant Anthropic prepares to sell stock to the public; files preliminary IPO paperwork - NPR (Business)
- Remote work — not AI — has sidelined recent college graduates, research finds - NPR (Business)
- Barry Diller Offers to Buy Rest of MGM in Deal Valued at Nearly $19 Billion - Bloomberg.com (Business)
Local Media
Lost Medicaid Funding
To date, the failure to expand Medicaid/TennCare has cost the State of Tennessee ? in lost federal funding. (Source)
Search and Archives
TN Progressive
Nearby:
- Blount Dems
- Herston TN Family Law
- Inside of Knoxville
- Instapundit
- Jack Lail
- Jim Stovall
- Knox Dems
- MoxCarm Blue Streak
- Outdoor Knoxville
- Pittman Properties
- Reality Me
- Stop Alcoa Parkway
Beyond:
- Nashville Scene
- Nashville Post
- Smart City Memphis
- TN Dems
- TN Journal
- TN Lookout
- Bob Stepno
- Facing South
Thanks for the link. I am
Thanks for the link.
I am always a little disappointed at seeing South-Doyle's statistics. I attended there when it was Doyle and thought it a pretty good school.
I compared South-Doyle to Bearden and Farragut.
Something is going on out there in SoKno County.
The ACT Participation Rate is only 53.5% at South-Doyle versus 70.8% at Bearden and 78.1% at Farragut. That is a pretty huge difference.
Cool, but...
Interesting, but not sure where these results came from.
TCAP scores?
Where the scores come from...
I think they come from the results of ACT testing..
ACT
A standardized assessment that measures students' general educational development and readiness to pursue college-level coursework in English, reading, mathematics, and science. The possible scores range from 1 through 36 for each of the four subjects. Because the ACT is based on high school curriculum, student performance on the test does not reflect innate ability and is influenced by students' educational preparedness. The ACT is administered in 50 states; and, in about 25 states more than half of all high school students who graduate take the test.
From the help section
And the data: